
21 Important Marketing Metrics and What They Mean
In this 21st Birthday Blog update, our Lincoln marketing agency team have put together a list of key digital marketing metrics that your business should be analysing. When you read marketing reports or look at insights from one of your digital marketing tools, it's important to understand what the metrics actually mean. We'll talk you through each of these metrics, how to calculate them, what they mean and what you should be aiming for! We've broken these down into four sections: Social media metrics, SEO metrics, PPC metrics and email marketing metrics, but many of these do cross over to different channels too.
So, let's get started!
Important Social Media Marketing Metrics
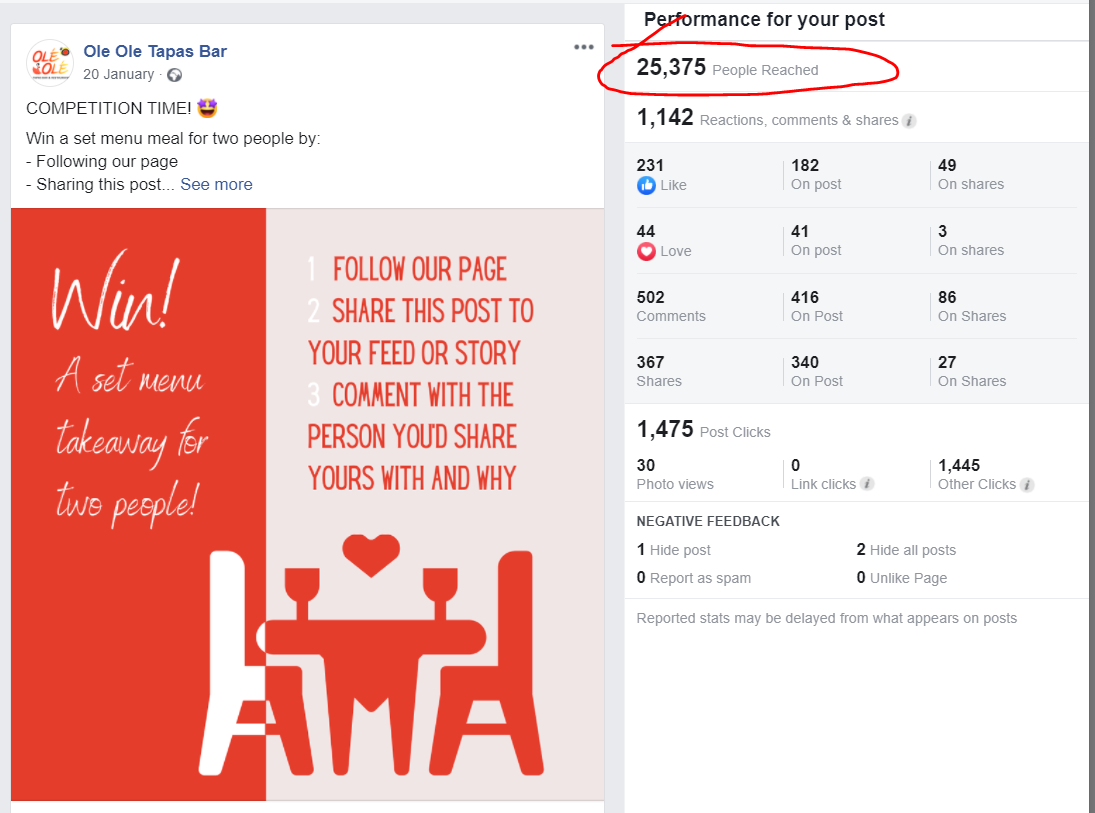
Reach: Reach refers to the number of users who have seen your post.
The higher your reach, the more people that have seen your post. A higher reach equals wider exposure and brand awareness of your brand, which is fantastic. Ideally, you’d like your reach to be as wide as possible, but reach isn’t always the best indicator of social media performance. Your post could gain a reach of 50,000 users but only have a 1.5% engagement rate, or you could gain a reach of 500 users and have a 5% engagement rate! So, reach is important, but you need to consider other metrics too if you want a full insight into your social media performance.
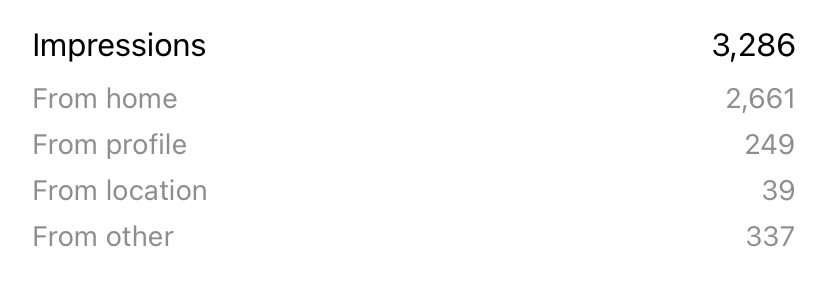
Impressions: Impressions refer to the number of times that your post has been displayed.
Impressions and reach are often mistaken for being the same thing, but this isn’t correct. For example, an Instagram user may see your post 3 times, once on their feed, another time directly from your profile and a third time on their explore page. This would count as 3 impressions, but reach would still only be 1 person.
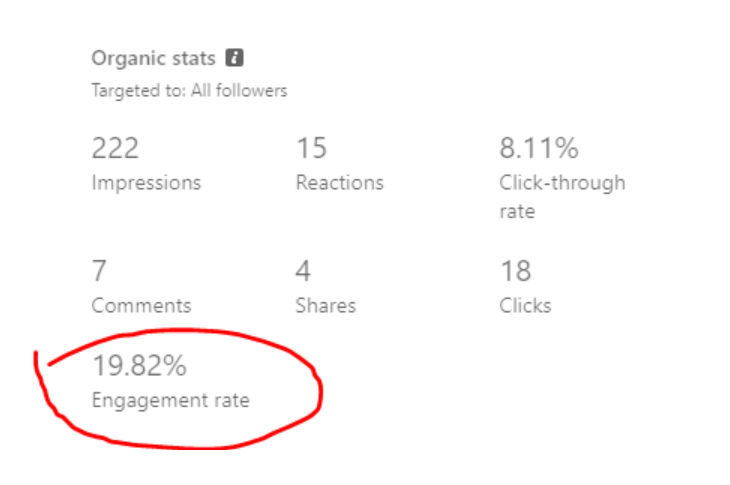
Engagement Rate (%): The percentage of people that saw your post and actively engaged with it (interactions ÷ impressions) - whether that be a like, a comment, a share or a save.
A high engagement rate indicates that your audience are enjoying your posts and that content is relevant to them. The more that your audience engage with your posts, the more likely they are to purchase from you and recommend you within their social networks. Engagement also helps to build brand loyalty, which is crucial to developing long-lasting customer relationships. Engagement rate is commonly shown on LinkedIn and a good engagement rate is considered as 2% or above.
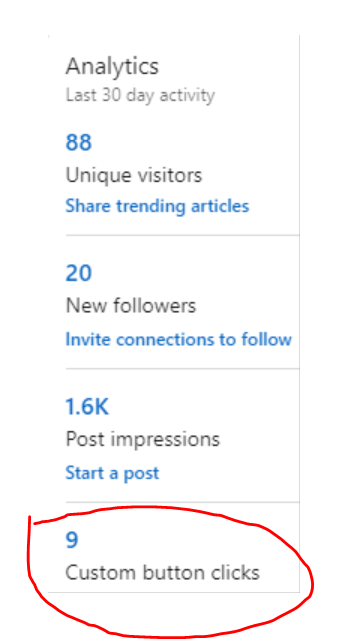
Custom Button Clicks: Custom button clicks refers to the number of times a user has clicked onto a link posted to your social media.
For example, you might share a link to a blog article on LinkedIn, or to a seasonal menu on your Facebook page. The number of custom button clicks tells you how many people actually opened the link and indicates their interest in your content. You can use this metric as a guide to show how effective your post was at encouraging an action, and also to see which types of content receive most clicks. This may help to advise future content ideas for your social media, as well as best-performing times for scheduling.
Important SEO Metrics
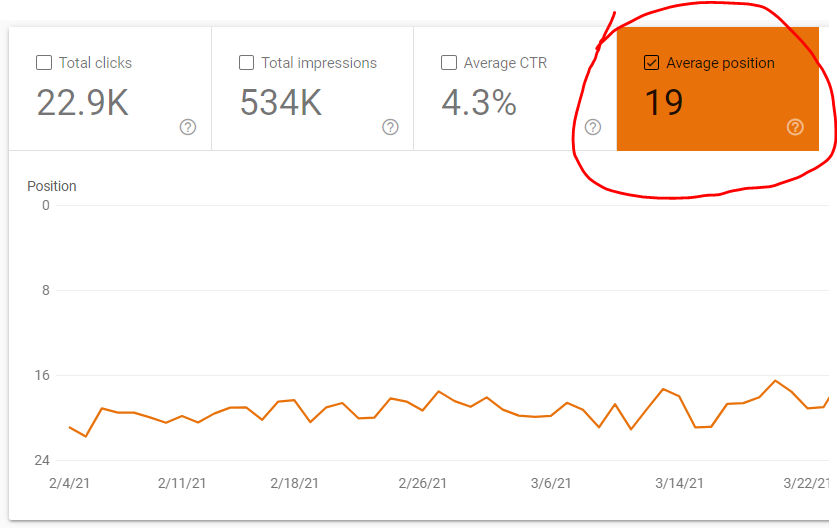
Search Visibility Position: The average position in which your website is displayed in search results for a particular query.
Tools such as Google Search Console are a must-have for marketing analytics and measuring online performance for your website. Your website as a whole is given an average search visibility position, but you can also access positions for individual keywords. Ideally, you want to appear on the first page of search results, as close to position 1 as possible, as this is where you’ll attract the most traffic- So, the lower your Search Visibility Position, the better! Search Visibility Position should be continually assessed to see if SEO efforts are effective and also to identify new keywords of focus to optimise across your content and improve on.
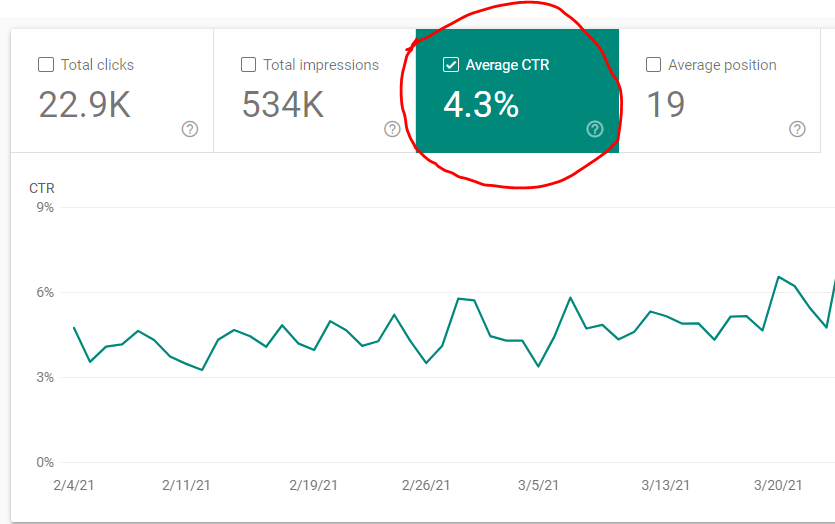
Average Click-Through Rate (%): Average CTR is the percentage of times your website has been clicked on when shown in search results. This is calculated by using the following formula- (Clicks ÷ Impressions) x 100.
Average CTR is an important figure to review, as it indicates how often your website is attracting clicks when shown in search results, effectively allowing you to identify how attractive your website appears to search engine users. Ideally, you want your CTR to be as high as possible, but a good target CTR would be around 4%.
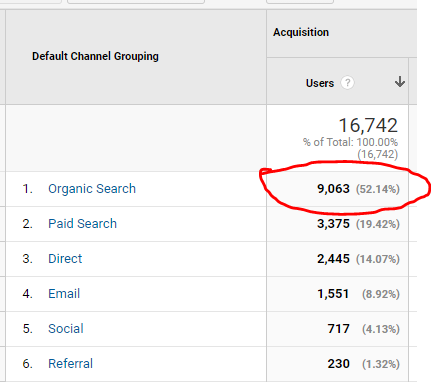
Organic Users: The number of users who have visited your website after finding it in organic search results.
Measuring monthly organic users on your website is important, as it tells you how many users have come to your website after finding you in search results pages. The higher the number of organic users that you gain, the better! An increase in organic users indicates that SEO efforts are paying off and that more users are discovering your website and becoming aware of your brand. It also shows that you’re optimising for relevant keywords with strong demand! If your organic users aren’t increasing after making efforts to improve SEO, you may be focusing on the wrong keywords.
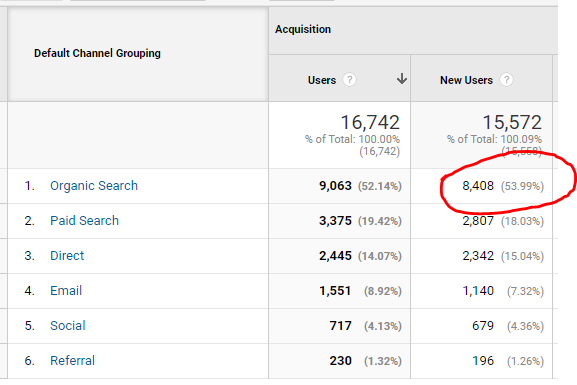
New Users: The number of users visiting your website who haven’t visited before.
New Users is a useful statistic to look at, as it allows you to identify how many users have found your website for the first time in a certain time frame. We use Google Analytics and tracking code to calculate this figure, which is a good performance indicator to measure organic growth. You can also use analytics to measure returning visitors, which identifies how many users have visited your website more than once- perhaps a more likely audience to consider purchase.
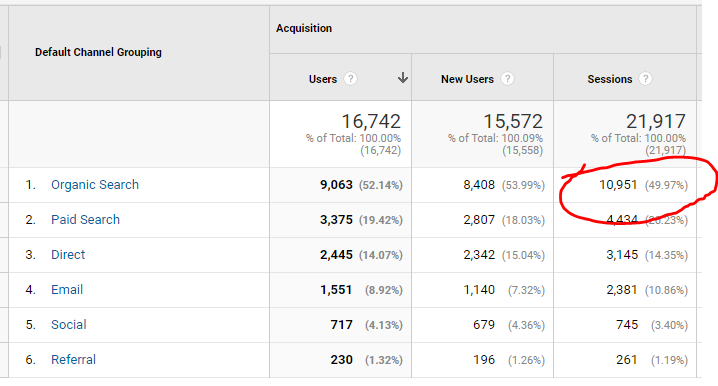
Sessions: The number of times a user has visited your website.
Sessions and users are different, as a user may visit more than once, totaling a larger number of sessions than users. This is a useful figure to track and analyse, as it helps you to calculate other statistics such as conversion rate, as well as identifying any growth or decline in website visits over a set period of time. Looking at this data can help you to recognise any seasonal trends, fluctuations and identify the need to step up SEO efforts if sessions are declining.
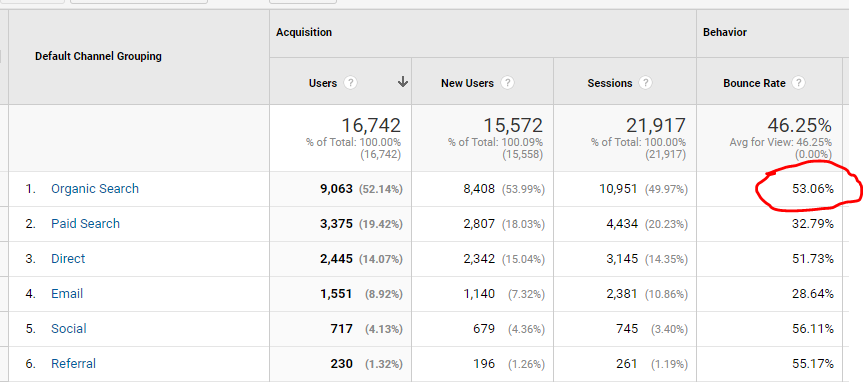
Bounce Rate (%): Bounce Rate is the percentage of visitors that leave a webpage without taking an action, such as clicking on a link, filling out a form, or making a purchase.
The aim is to have bounce rate as low as possible, ideally 40% or below, but average bounce rate is estimated at roughly 50%. Bounce rate is an important statistic to measure, for various reasons, one being that is someone bounces from your site, this means that they haven’t converted- By stopping a visitor from bouncing, you can increase your conversion rate. Improving website content, website experience and using exit-intent technology are key to reducing bounce rate on your website! If bounce rate is high, you should investigate why this is. Bounce Rate is also used as a Google search ranking factor, so if you have a high bounce rate, you may be ranked lower in search results.
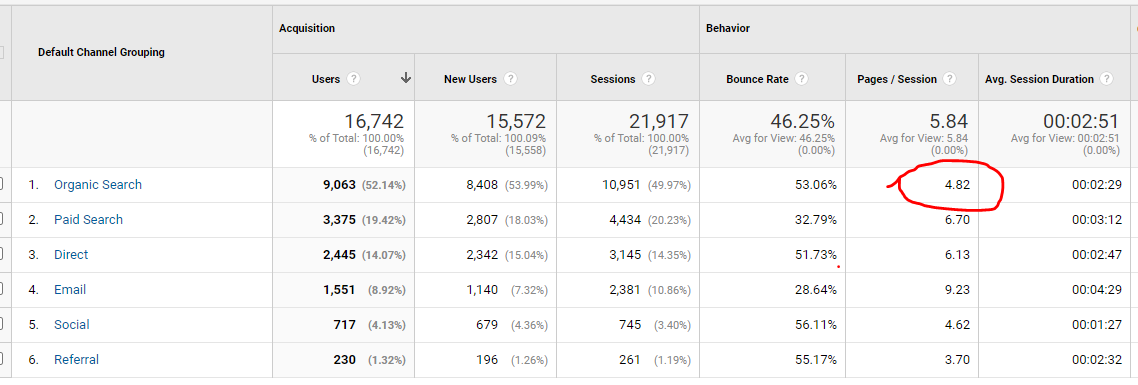
Pages Per Session: The average number of website pages visited within a session.
Pages Per Session is another useful statistic to look at, as it effectively shows how much a user is looking at on your website. This indicates an interest in your website content and positive user experience! Ideally, you want this figure to be as high as possible, so that your visitor is seeing as much of your website as possible. A low number of average Pages Per Session could suggest that your website isn’t relevant to your visitors, content is poor quality or experience is poor quality.
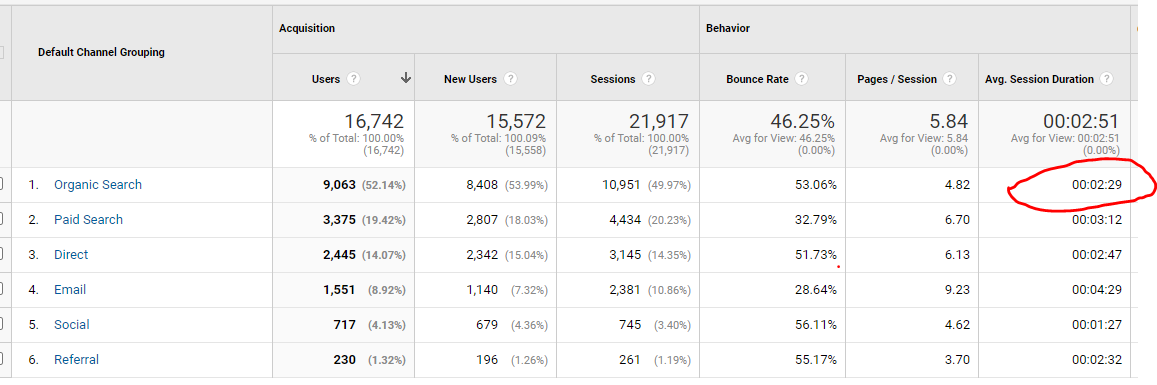
Average Session Duration: The average amount of time spent on the website in a session.
This figure is useful as it tells you roughly how long users are spending on your website in a session, offering an indication of their interest and user experience. Ideally, you’d like users to be spending a longer length of time on your site, which suggests that they are engaged with your content, browsing different pages, reading information etc. A short session duration could indicate that content isn't relevant or that the user isn’t having a quality experience on your website.
However, this being said, it’s important to identify whether a customer is spending a long time on your website because they’re interested, or whether it’s because your website is slow, difficult to navigate or if they’re experiencing technical difficulties. Therefore, it is important to carry out website health checks and gain customer feedback, to give you a good insight into their experience.
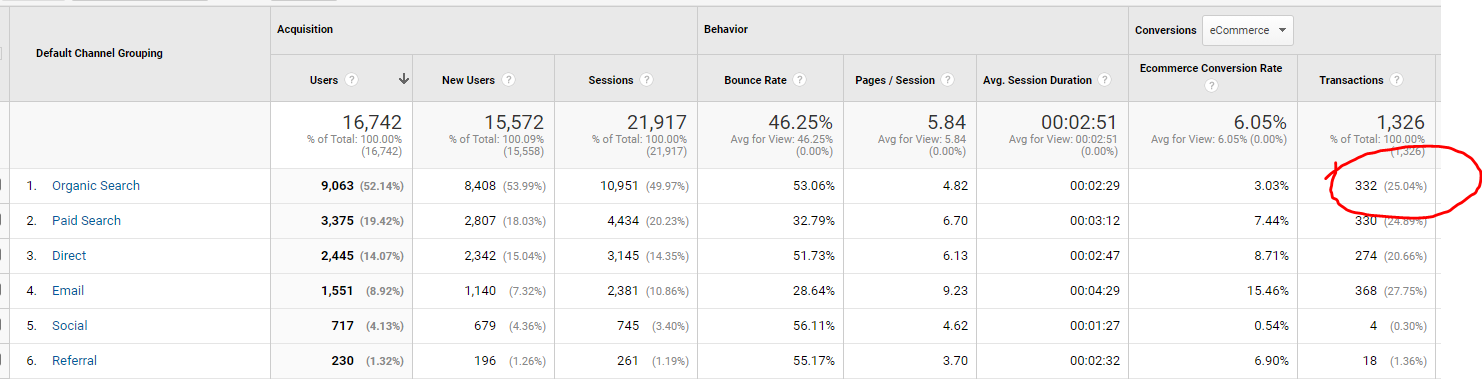
Conversions: A conversion is the completion of a desired goal on your website. Conversions don't have to be sales, they can also be email sign-ups, form completions, phone calls and email contacts. Tracking code can be placed onto different areas of your website, which allows us to track conversions in analytics. This is one of the most important figures that you need to be tracking in order to measure performance. In the example shown below, our clients desired conversions are transactions.
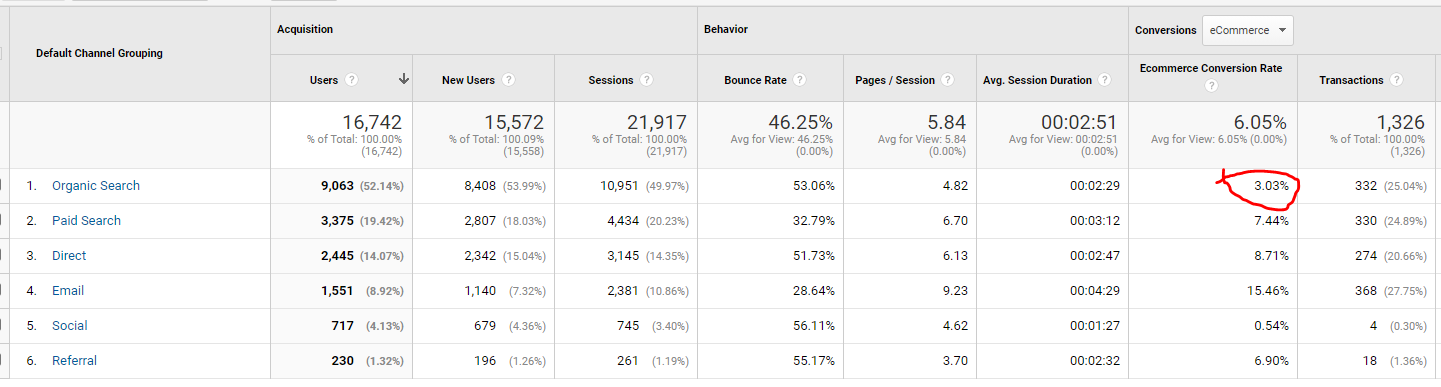
Conversion Rate (%): The percentage of sessions which resulted in a conversion (Number of conversions ÷ number of sessions).
Conversion rate is a key performance indicator, as it tells you which percentage of website visits are resulting in a conversion. Knowing how many conversions you have made is helpful, but if you're only making 10 conversions per 1000 visitors, then this suggests that your business isn't performing as well as it should be. You should consider how to increase conversion rate, whether that be to improve on-page experience, usability, convenience, design or use exit-intent technology! The higher your conversion rate, the better, but 5% is a good percentage to aim for!
Important Pay Per Click Metrics
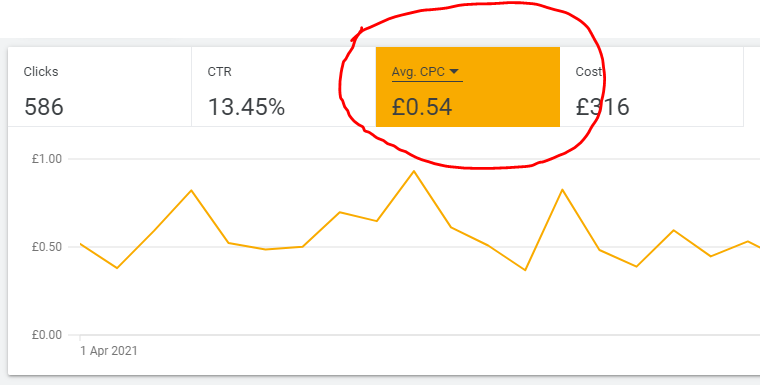
Average CPC: Average Cost Per Click is the total ad cost, divided by the number of clicks gained.
Some markets and keywords are more competitive than others, so Average CPC can differ depending on who you’re targeting, what keywords you’re targeting and also which PPC platform you’re using (I.e. Facebook, Google, Bing). Ideally, you want Average CPC to be as low as possible, to maximise clicks within your budget. You should monitor your Average CPC each month to identify any rise or fall in cost, and make necessary adjustments to the ads account.
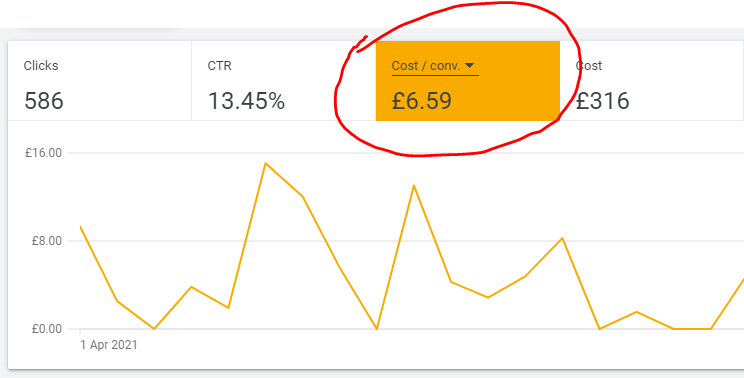
Cost Per Conversion: Cost Per Conversion is total cost, divided by total conversions.
Like with Average CPC, Cost Per Conversion differs depending on your target market, audience and keywords, as well as PPC platform. Cost Per Conversion is effectively the cost to a business of acquiring a customer, for example, Cost Per Conversion may be £5, to attract a customer who spends £100. You want your Cost Per Conversion to be as low as possible, in order to increase your profit margins.
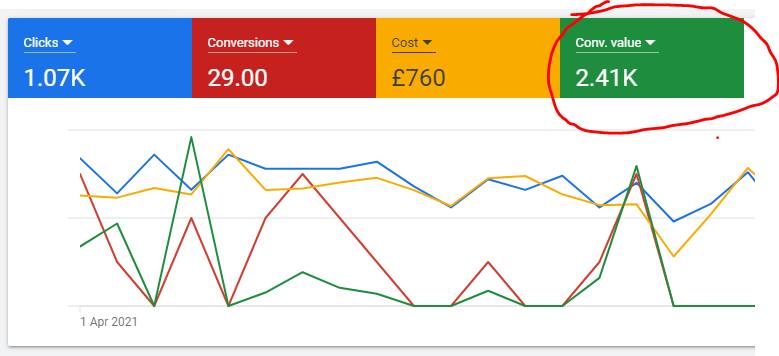
Total Conversion Value: The total monetary value of your conversions.
If you're using PPC ads to sell products on your website, you'll be able to track your Total Conversion Value, which tells you to the total value of all of your conversions combined. For example, if you made conversions worth £350, £150 and £250, your Total Conversion Value would be £750. You can then use this figure to calculate other metrics, such as Total Return On Ad Spend (ROAS). You want your conversion value to be as high as possible!
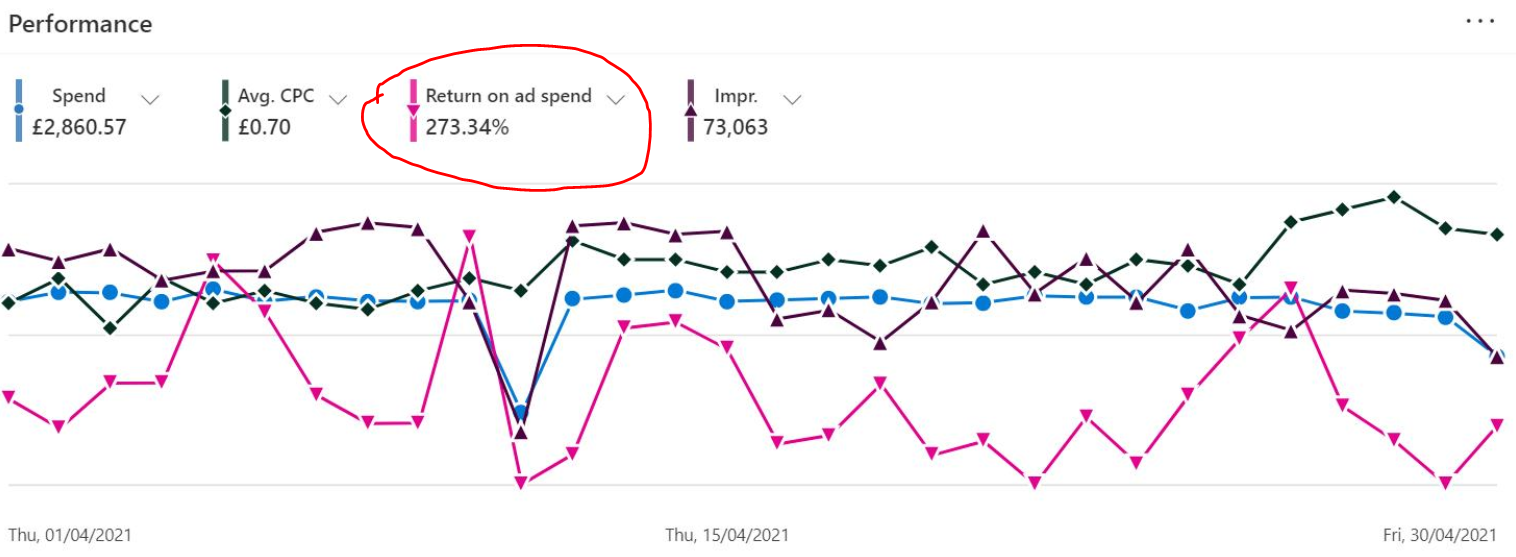
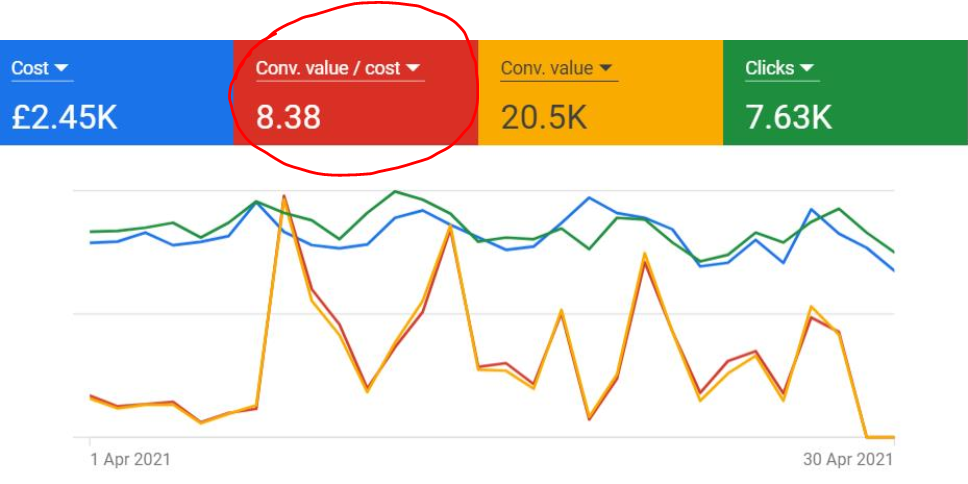
Return On Ad Spend (ROAS) or Conversion Value / Cost: ROAS is calculated by dividing conversion value by advertising cost. You may also see ROAS named Conversion Value / Cost on Google Ads.
If it costs you £20 in ad spend to sell one unit of a £100 product, your ROAS is 5 (or 500%). This means that for every £1 you spend on advertising, you earn £5 back. ROAS measures the effectiveness of your advertising- the more effectively that your ads connect with your target audience, the more revenue you’ll earn from each pound of ad spend. The higher your ROAS, the better.
Important Email Marketing Metrics
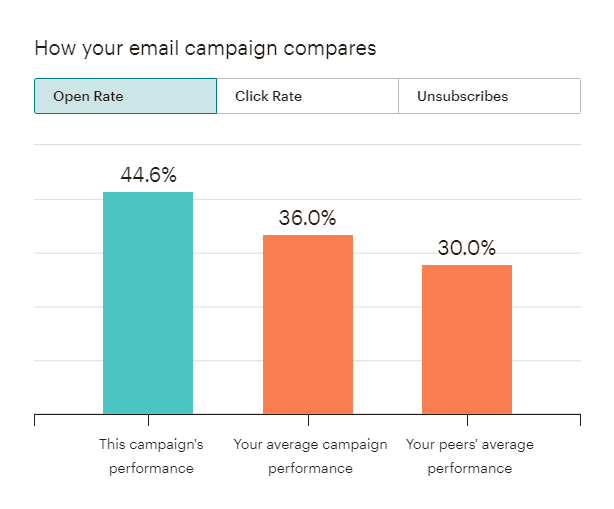
Open Rate (%): The percentage of your audience who received your email and opened it (number of people who received the email ÷ number of people who opened it).
We all know how it feels to receive endless emails from various brands that we’ve purchased from over the years, or subscribed to for a sign-up discount! Whilst email marketing can be very effective, a large number of emails get lost in customers inboxes- never to be opened. Open Rate can be used to measure how effective your email campaigns are and how many of your audience are actually reading your communications. Typically, an Open Rate of 25% or above is classed as good (the higher, the better). Open Rate is useful for allowing you to identify which types of content are opened most, which headlines are most persuasive at encouraging a recipient to open, and which times are best to send your campaigns.
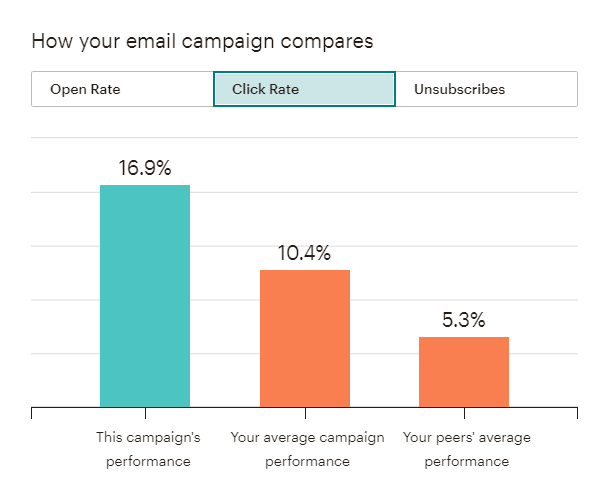
Click Rate (%): Click Rate is the percentage of email readers who have clicked on the links in your email.
Emails exist for the purpose of communication and marketing, often used to promote a new product, tell customers about a special offer or to provide useful, relevant content for your target audience. To drive your readers to take an action or visit a particular webpage, emails should include links and a clear call-to-action. Click Rate tells you how many of your readers clicked the links in your email and ultimately may have made a conversion (further tracking can give you insights into conversions, conversion rate and conversion value). Looking at which emails gained the highest click rate is important to identifying which types of content attract the most engagement from customers and advising future marketing communication plans. For a guideline, a good click rate is considered at 4% or higher.
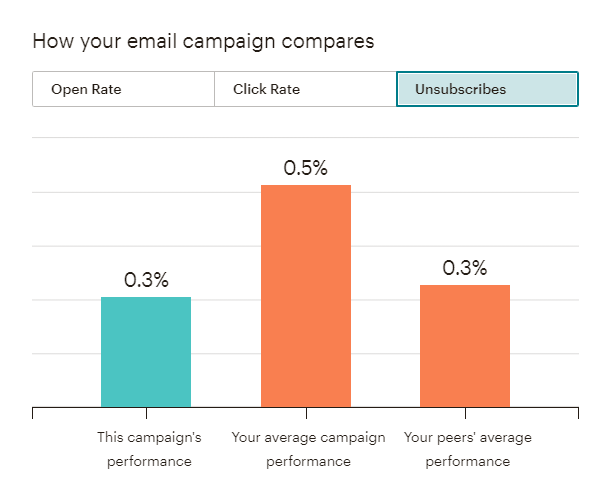
Unsubscriber Rate (%): The percentage of email recipients who unsubscribed to your emails after receiving.
A high Unsubscriber Rate could indicate that your audience aren’t interested in your communications or are annoyed by your emails. If your Unsubscriber Rate is high then you should delve deeper into your marketing analytics and consider: Is your content relevant to your audience? Is your messaging inconsistent? Is it too persistent? It is good to keep Open Rates and Click Rates high, and Unsubscriber Rates low. Unsubscribers are inevitable but try and keep them to a minimum- a good Unsubscriber Rate is typically considered at 0.5% or less!
Marketing Analytics and Reporting Support
Setting up analytics is fairly simple, but if you don't have the right tools or people in your business who are experienced to do this, it can cause complications.
This is where iocea is here to help, as our Lincolnshire digital marketing agency team can set up analytics tracking for a variety of tools, such as Google Analytics and Google Search Console. Setting up analytics allows you to keep track of important performance indicators, such as conversions, bounce rate, traffic, conversion value, average session duration, new visitors and returning visitors. Using advanced analytics tools, we can further assess this data with filters such as traffic source, visitor demographics and more.
For iocea digital marketing package clients, analytics set up and reporting is included. We really do cover all areas! Depending on your requirements, our Lincoln Digital Marketing team will compose monthly reports, summarising your performance and making relevant recommendations. We'll even follow up with a call, where we can discuss the findings and plan our next steps together!
Click here to learn more about our marketing analytics and reporting services.